TMMS OscillatorThe TMMS oscillator (aka “Trading Made More Simpler”) is an indicator made of conditions based on both 2 separated Stochastic and 1 RSI.
Bullish zone is green and bearish one is red. When the histogram is grey, no signals is available at that time.
The indicator has an option to show the current trend of an Hull moving average (ascending or descending curve). When the trend is up, green dots are plotted on the zero line. When the trend is down, the dots are coloured in red.
Greetings, success with your trade!!!
"Buy sell"に関するスクリプトを検索


Climatic Volume X- Climate volume detection
- Relative volume value in bar
- Automatic zone generation (possibility of configuration)
- Additional features
¡¡¡Thumbs up¡¡¡
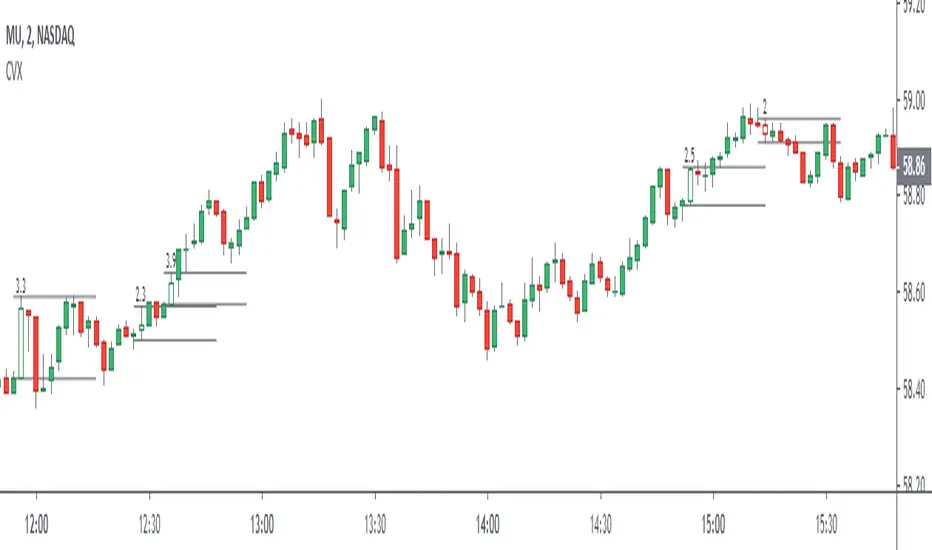
Elephant Bar by Oliver VelezThis script detects an event created by Oliver Velez, basically it is a wide-range candle, its range is noticeably larger than the previous candles, this event indicates a possible continuation of the movement, or the beginning of an extended movement. The candle has to be of good body, as a rule it can be taken that the body must be more than 70%. The stop goes below the minimum of the candle and the signal is given when the next candle followed by the elephant candle exceeds its body, this condition is not programmed so that the alert indicates that an elephant candle was generated and the trader has some time to visualize the graph and wait for the signal. Example below:
NOTE: IT IS VERY IMPORTANT THAT THE TRADER ANALYZE THE CONTEXT OF THE MARKET WHERE THE ELEPHANT BAR IS GENERATED AND DETERMINE ACCORDING TO ITS EXPERIENCE IF THE EVENT HAS A GOOD PROBABILITY OF PROJECTION, YOU MUST NOT TAKE AN ENTRY ONLY BY THIS EVENT, IF YOU DO YOU WILL LOSE ALL YOUR MONEY
.
One of the problems of the elephant bar is that it generates a fairly wide risk unit with respect to other narrow range events, so the risk / benefit ratio is not very large, but it is an event that deserves attention when it occurs in a good location since it generally generates continuation.
If you want to have a lower risk unit and improve the risk / benefit ratio, you can play the “Gift Zone”, when detecting an elephant bar you can wait for a step back inside the elephant bar area and take a position, this will give you a less distance to the stop, but this can lead to the event escaping if there is no recoil.
- The size of the candle is determined by comparing a range of previous candles (you can set the amount at your discretion)
- Search factor: by default 1.3, this means that all bars that have a range greater than the average range of previous candles + 30%, are considered elephant candles (can be configured at your discretion)
- Possibility to configure the percentage of the body that the elephant candle must have.
- Possibility of filtering up to 2 means with direction detection and color change (fully configurable)
- Possibility of filtering by mobile averages
- Alerts
- Additional features
Thumb up if you liked me ..

Histogram Trends Strategy by SedkurThis gives to you buy-sell signal with MACD's histogram trends.
Use "Fast and Slow length" and "Trend of Histogram Number" inputs to take less or more signal.
"Trend of Histogram Number" : This means how many histogram bars the trend continues before trading.

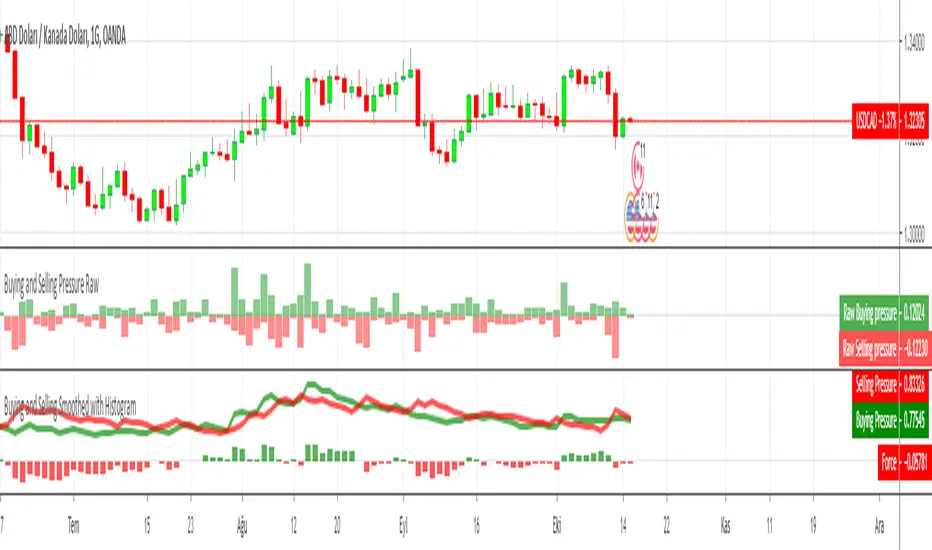
Buying and Selling Pressure RawBuying and Selling Pressure Raw
Raw Buying and selling pressure Indicator. The Raw buying and selling indication is provided in terms of a Columns.
Green bars above zero show the buying pressure and the red bars below the zero line show the selling pressure.
This presents a good visual representation of the dominating pressure.
MACD Strategy by SedkurThis gives to you buy-sell signal with MACD histogram value.
Use "Fast and Slow length" and "Buy or Sell Histogram Value" inputs to take less or more signal.

Brandon BollSecond day at Pinescript and I am attempting to tweak the Bollinger Bands directed strategy to send alerts to Zignaly in order to automate long buy/sells.
I've left in the short script though for completeness.
The buy and sell instructions work perfectly but I don't know how to do a cancel order alert (as included in the original strategy)

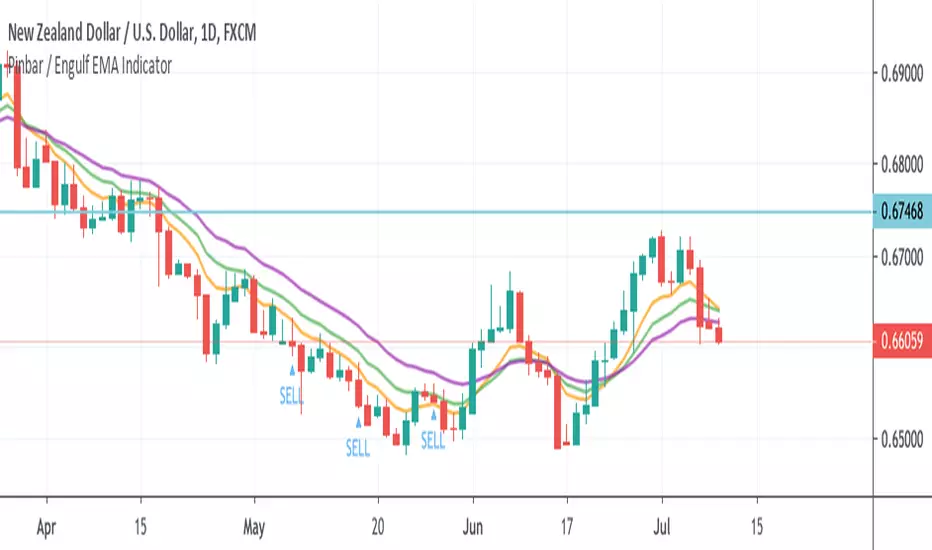
Pinbar / Engulf EMA IndicatorThis indicator is built based on the video by ForexSignals TV (no association on my part with them), published on July 5th, 2019 titled "SIMPLE & PROFITABLE Trend-following Forex Trading Strategy!"
The basic premiss is to use the 8,13,21 EMAs, make sure they have not crossed in the previous 3 bars, then look for engulfing bars or pinbars for the current direction. Meaning if the trend is up, look for bullish engulfer or pinbars, and bearish ones if the trend is down. Also, the pin must have crossed the 8EMA but not the 21EMA.
When determining to act on the signal, the video recommends only executing a buy/sell if the the current trend in the anchor chart is trending in the same direction (trending up only enter buys, trending down, only enter sells).
The script overlays a BUY or SELL tag under the bar that meets the above criteria.
Fib Divergence SystemCombo of many useful indicators which includes fib lines, time and money channels and divergence buy sell signals
Credits for source code:
Scarf, Lazybear, 100kiwi

Steroid CCI w/ Overbought & Oversold Alert//@version=2
//By Tantamount
//Channel Commodity Index (CCI) with overbought and oversold alert features! Highly configurable indicator that includes a Topography map feature, used to detect & show minute threshold crosses.
//CCI is a momentum based technical trading tool used to help determine when an asset is reaching an overbought or oversold condition and is an great alternative to RSI.
//This CCI tool comes loaded with features and is easily configurable back to standard CCI or with your own preferences.
Customize to your liking:
Simple alert signals
The full enchilada, with Topo map view!
Stand alone CCI oscillator

Multiple MACD RSI simple strategySimple strategy script I've had for a while but looks like I never published.
Although it is one of my most simple it seems to have the best profitability. It is pretty rough though. the Stoch RSI has only a little weight to the trade trigger. I'll refine it more over time or you can by all means. Basically the Stoch RSI current K line has to be OVER 40 to trigger a SELL. It has no effect on buy side.
The triggers are roughly as follows:
Year - since so many assets have gone 2x, 3x, 10x+ since 2013 having a strategy that earns a 500% return from 2013 to now isn't that good if buy-and-holding would have got you 800%. This eliminates some of that noise and makes it a little easier to quickly gauge success. So buy/sell trigger need a value of greater or equal to 2018 (default)
MACD 1 - First MACD (short) needs to indicate greater than 0 to buy or less than 0 to sell.
MACD 2 - Same as MACD1 but for second MACD set (long)
Uptrend - Latest close + high divided by last periods close + high needs to be grater than 1. So if latest is 34.30 close and 34.60 high and previous interval is 34.80 close and 34.82 high, that is 0.99 and will not trigger a buy trade.
Downtrend - Same thing but close + low and less than 1.
This script/strategy is pretty rough but if there is interest I'll polish it more since it is a pretty solid but simple strategy for most assets.

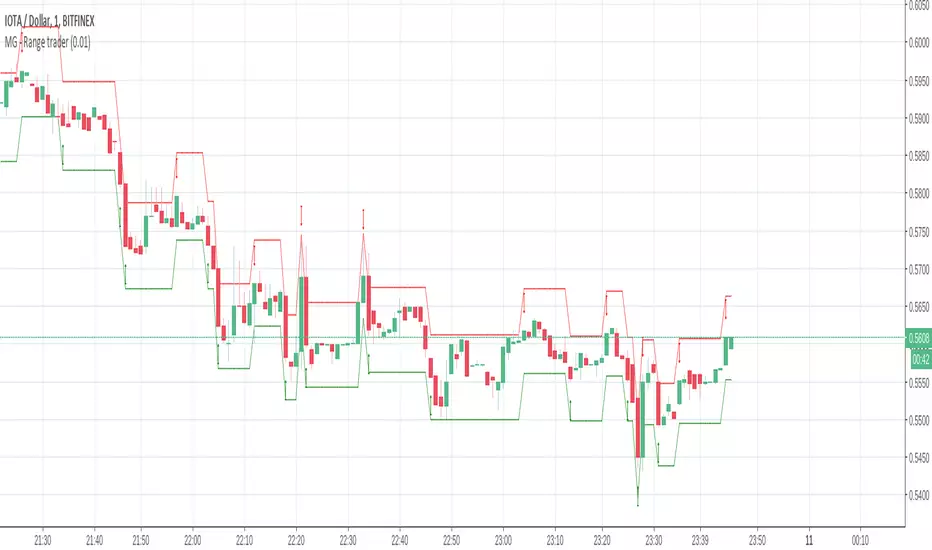
MG - Range trader - 1.0This one is a bit of an experiment..
The theory is, if you have an asset that you firmly believe will rise in the future for fundamental reasons and are happy to hold until that happens i.e. a be a position trader, you can take advantage of market volatility at the same time in a relatively safe way, so theoretically, you profit when the price goes up or down
E.g. You have $1000, an asset in which you want to become a position trader and you are happy to either make more money or more of the asset as you believe that will make you more money in the future, you could wait until a decent retracement, maybe around a good support level, then buy $500 of the asset and simply sell if it goes up by X, buy if it goes down by X. If you keep doing this, you will end up with either with more of the asset or more money. You have a sure gain either way (if you are happy to have either money or asset)
There are some considerations:
The higher the trade size, the faster profit compounds and the faster you exhaust your available buys and sells
- E.g. If asset is $100, you have $500 and you plan to buy / sell every $10 change, if the asset drops straight to $40, your last buy will be at $50, at which point, the asset is still dropping. But it you only plan to buy / sell $5 every $10 price, you will be able to buy right down to 0.
In times of strong trend, it may be better to avoid this approach altogether as there may not be so much oscillation or at least to use a small if not minimum order size.
Application:
The buy and sell triggers can be connected using autoview to convert this indicator into a range trading bot
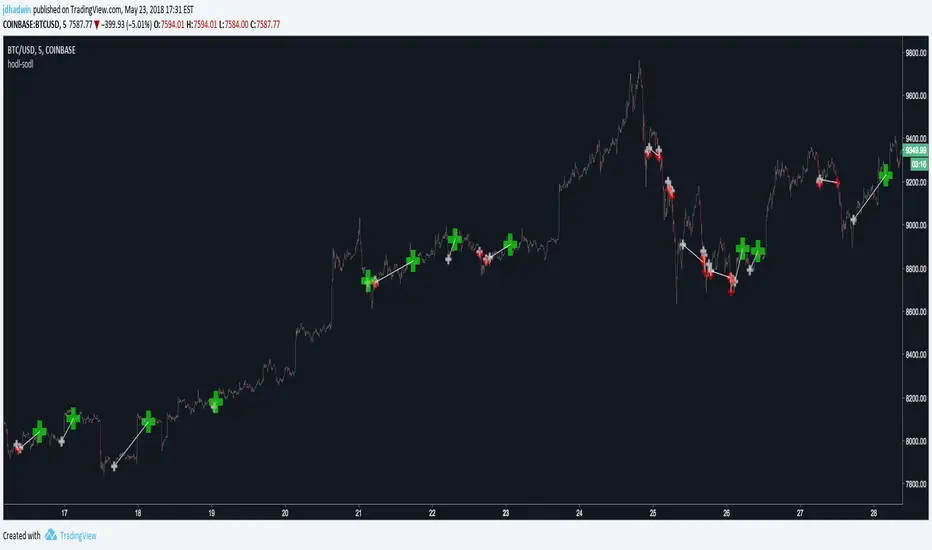
AutoView - Hodl to SodlWrite your own strategy and use Hodl to Sodl to send Alerts for when to buy & sell, and automatically plot your anticipated buys/sells to the chart. A must have for AutoView users. Requires Pine Script coding. Not compatible with "Strategy Tester" tab and "Paper Trading" tab in TradingView.
Hodl-Sodl itself is not a strategy. It is a framework for building AutoView strategies. For demonstration purposes, the image featured with this script shows an example of a very simple CCI strategy (and not a very good one), but you would presumably replace that with your own ideas. If you'd like a little help plugging in your own strategy, contact jdhadwin for custom coding.
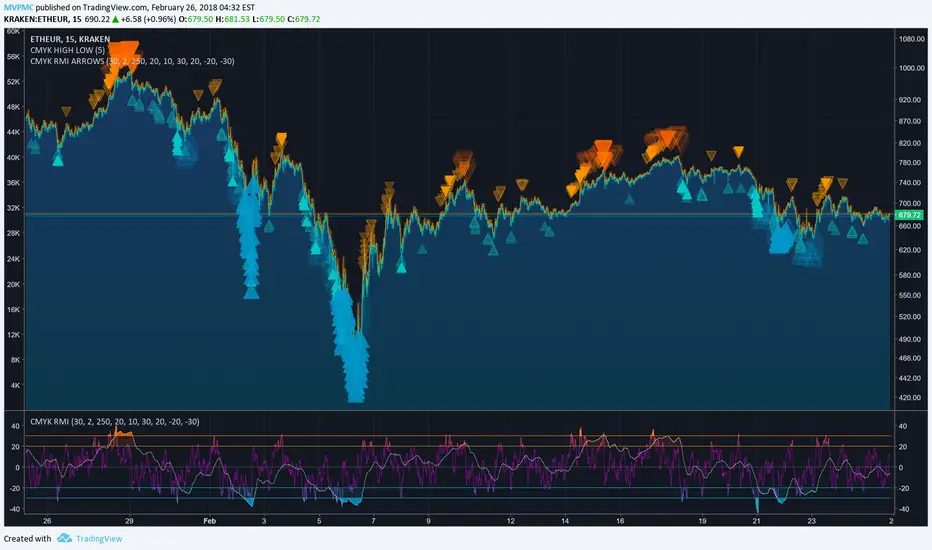
CMYK RMI ARROWS◊ Introduction
I started using this script because of its fast reaction, and good tell for buy/sell moments.
For larger timescales, the overall trend should be taken into account regarding the levels.
In the future i will update this indicator, to automatically adjust those.
This is the Overlay expansion of the Indicator Linked below.
◊ Origin
The Relative Momentum Index was developed by Roger Altman and was introduced in his article in the February, 1993 issue of Technical Analysis of Stocks & Commodities magazine.
While RSI counts up and down days from close to close, the Relative Momentum Index counts up and down days from the close relative to a close x number of days ago.
This results in an RSI that is smoother.
◊ Adjustments
CMYK color theme applied.
Four levels to indicate intensity.
Two Timescales, to overview the broader trend, and fast movements.
◊ Usage
RMI indicates overbought and oversold zones, and can be used for divergence and trend analysis.
◊ Future Prospects
Self adjusting levels, relative to an SMA trend.
Alternative RMI, which functions as an overlay.
◊ ◊ ◊ ◊ ◊ ◊ ◊ ◊ ◊ ◊ ◊ ◊ ◊ ◊ ◊ ◊ ◊ ◊ ◊ ◊ ◊ ◊ ◊ ◊ ◊ ◊ ◊ ◊ ◊ ◊ ◊ ◊ ◊ ◊ ◊ ◊ ◊ ◊ ◊ ◊ ◊ ◊ ◊ ◊ ◊ ◊ ◊ ◊ ◊ ◊ ◊ ◊ ◊ ◊ ◊ ◊ ◊ ◊ ◊ ◊ ◊ ◊ ◊ ◊ ◊ ◊ ◊ ◊ ◊ ◊ ◊ ◊ ◊ ◊ ◊ ◊ ◊ ◊ ◊ ◊ ◊ ◊ ◊ ◊ ◊ ◊ ◊ ◊ ◊ ◊ ◊ ◊ ◊ ◊ ◊ ◊ ◊ ◊ ◊ ◊ ◊ ◊ ◊ ◊ ◊ ◊
░▒▓█ CMYK ◊ RMI █▓▒░
Gunbot MACDgenOk this is just some strat based on MACD, checking for a few conditions until giving buy/sell signals to Gunbot via alerts.
It is generalized but if you want to go play with the values. I will continue to develop this further and am happy to receive feedback.
Notations are coming.
Usage notes:
-ONLY use this with TV_GAIN: 0.6 because on downtrends it is supposed to double up to pull down the average bought price!
-Use "buying condition" and "selling condition" for alerts, trigger on close and I suggest you use 3 min intervals but try what looks good to you
-Use this on pairs that are curvy and have atleast 0.6% gain between buy/sell triggers. This is also general advise when you want to take microprofits.
-Don't be confused with sell arrows, it will only trigger the bot sell on gain when you've set TV_GAIN

Stock Market Trend Analysis Trading System 101 (by ChartArt)This is a very simple trading system which is measuring the core of uptrends and downtrends using three basic elements: Close price, HL2 price, Pivot price.
Depending if the uptrend or downtrend is strong, the buy/sell signals are shown in different colors. The stronger trends are in brighter colors (lime and fuchsia). If the trend just fully changed direction from uptrend to downtrend (or vice versa), there is a background color highlight in the color of the new trend direction.
The trend detection should work best on monthly charts. I have created this in under an hour. My goal was to use the least amount of rules possible, therefore there are many false signals and the code is quite lazy.
You can lose all your money if you rely on these buy/sell signals!

Scalp EA for 15 Minute Timeframes and HigherSo I have written this indicator based upon the percentages of the High and the Low of the candlestick with respect to the open price. This indicator by no means tries to find top's and bottom's;however, it does find good opportunities for 5-20 pips reversals or continuations. The signal is provided without delay and should only be based upon the closing of the candle. For example, at open- the indicator will tell you "buy, sell, or remain flat" but you should only buy or sell when the candle has completely closed.
Choose whether to use it for scalps, or to set up larger trades with bigger time frames and support or resistance zones.
*Warning*- This is untested and will remain untested due my unavailability.
Reason behind the coding: As I trader, I like to think that I am always "buying low and selling high"or "selling high and buying low". Throughout my trading experiences, I can tell you that I have done the opposite many times. This indicator helps me in finding opportunities as I have written it to always Sell at the closing price of a green candle and always to buy at the close of a red candle. The indicator makes the attempt to Sell High and Buy Low.

Delta/Volume Bubble Strategy [Quant Z-Score] Maxxed VersionDelta/Volume Bubble Signals Maxxed Verison
This indicator combines advanced volume delta analysis with smart filtering to generate high-conviction intraday signals on futures like YM, ES, and NQ (5-minute charts perform particularly well in testing).
Special thanks to L&L Capital for the LNL Trend System, which provides the excellent dynamic chop detection and cloud visuals used here.
A very BIG thanks to tncylyv for the original volume delta bubble script — its Z-score normalization on extreme volume/delta is the foundation of the core detection logic.This entire system is now possible thanks to TradingView's addition of Volume Delta data in the Footprint chart, allowing accurate lower-timeframe delta aggregation without external feeds. Core Concept the indicator identifies extreme volume/delta spikes — moments when significant buying or selling pressure appears — and only signals when multiple confluence filters align. This results in lower-frequency, higher-quality trades that aim to capture institutional momentum while avoiding noise.
How It Works — Key Components Volume Delta Detection (The Heart of the System) Uses TradingView's built-in footprint delta (aggregated from lower TF, default 1-second bars).
Calculates absolute delta and applies a rolling Z-score (default lookback 60 bars) to normalize extremes across different volatility regimes and instruments.
Bubbles visualize spikes above threshold (default 1.7σ).
BUY/SELL signals require the same threshold plus additional filters.
Absorption Filter (Enabled by Default) Detects high volume/delta with minimal price movement ("effort vs result" failure = trapped traders).
Purple glow on bubbles + optional alert.
Signals are suppressed on absorption bars to avoid counter-trend traps.
Trend Filter (Nadaraya-Watson from jdehorty as default) Non-repainting kernel regression line for smooth, adaptive trend following.
Signals only fire when price is on the correct side of the trend line (above for longs, below for shorts). Can be disabled or switched to EMA/WMA/KAMA.
LNL Chop Filter (Tight Mode by Default) Dynamic ATR-based stop zones from L&L's system.
When stop levels appear on both sides of price = sideways/chop (no-go zone).
Signals completely suppressed during chop.
Usage Tips Best on intraday futures (YM 5-min has shown strong results in testing).
Defaults are tuned for balance: 1.7σ threshold, Tight LNL mode, absorption on.
Strategy version (separate script) adds LNL trailing stops for actual backtesting/exits.
Customize freely — try different LNL modes (Net for wider range), trend types, or Z-thresholds.
Also available the matching indicator by yours truly.
Important: Forward Test Thoroughly This indicator was refined on historical data, so there's always risk of over-fitting.
Always forward test on live or paper accounts for weeks/months before real capital: Validate across different market regimes (trending, ranging, high/low volatility).
Compare out-of-sample periods.
Adjust one parameter at a time and re-validate forward.
Markets change — what worked yesterday may need tweaking tomorrow.
Feel free to use, modify, and share. Good luck, and trade well! — Max

ronismc333 דור בן שימול: //+------------------------------------------------------------------+
//| SMC GBP PRO EA – FTMO Ready 30M עם חצים |
//+------------------------------------------------------------------+
#property strict
input double RiskPercent = 1.0;
input int RSIPeriod = 14;
input int StopLossPoints = 200;
input int TakeProfitPoints = 400;
input int MagicNumber = 202630;
input bool EnableAlerts = true;
int rsiHandle;
//+------------------------------------------------------------------+
int OnInit()
{
rsiHandle = iRSI(_Symbol, PERIOD_M30, RSIPeriod, PRICE_CLOSE);
Comment("SMC GBP PRO EA\nStatus: CONNECTED\nAccount: ", AccountNumber());
return(INIT_SUCCEEDED);
}
//+------------------------------------------------------------------+
void OnTick()
{
if(PositionsTotal() > 0)
{
UpdateStatus();
return;
}
double rsi ;
CopyBuffer(rsiHandle,0,0,1,rsi);
double high1 = iHigh(_Symbol, PERIOD_M30,1);
double low1 = iLow(_Symbol, PERIOD_M30,1);
double close1= iClose(_Symbol, PERIOD_M30,1);
double high2 = iHigh(_Symbol, PERIOD_M30,2);
double low2 = iLow(_Symbol, PERIOD_M30,2);
//==== HTF TREND (1H EMA50) ====
double emaHTF = iMA(_Symbol, PERIOD_H1, 50, 0, MODE_EMA, PRICE_CLOSE, 0);
double closeHTF = iClose(_Symbol, PERIOD_H1, 0);
bool htfBull = closeHTF > emaHTF;
bool htfBear = closeHTF < emaHTF;
//==== LIQUIDITY SWEEP ====
bool sweepBuy = low1 < low2 && close1 > low2;
bool sweepSell = high1 > high2 && close1 < high2;
//==== BOS ====
bool bosBuy = sweepBuy && close1 > high2;
bool bosSell = sweepSell && close1 < low2;
//==== BUY/SELL CONDITIONS ====
bool buy = bosBuy && rsi > 50 && htfBull;
bool sell = bosSell && rsi < 50 && htfBear;
double lot = CalculateLot(StopLossPoints, RiskPercent);
if(buy)
{
OpenTrade(ORDER_TYPE_BUY, lot, StopLossPoints, TakeProfitPoints, "BUY GBP");
DrawArrow("BUY", 0, low1 - 10*_Point, clrLime, "BUY GBP");
}
if(sell)
{
OpenTrade(ORDER_TYPE_SELL, lot, StopLossPoints, TakeProfitPoints, "SELL GBP");
DrawArrow("SELL", 0, high1 + 10*_Point, clrRed, "SELL GBP");
}
UpdateStatus();
}
//+------------------------------------------------------------------+
double CalculateLot(int slPoints, double riskPercent)
{
double riskMoney = AccountBalance() * riskPercent / 100.0;
double lot = riskMoney / (slPoints * _Point * 10);
lot = MathMax(lot,0.01);
return(NormalizeDouble(lot,2));
}
//+------------------------------------------------------------------+
void OpenTrade(ENUM_ORDER_TYPE type,double lot,int sl,int tp,string comment)
{
double price = (type==ORDER_TYPE_BUY) ? SymbolInfoDouble(_Symbol,SYMBOL_ASK)
: SymbolInfoDouble(_Symbol,SYMBOL_BID);
double slPrice = (type==ORDER_TYPE_BUY) ? price - sl*_Point
: price + sl*_Point;
double tpPrice = (type==ORDER_TYPE_BUY) ? price + tp*_Point
: price - tp*_Point;
MqlTradeRequest req;
MqlTradeResult res;
ZeroMemory(req);
req.action = TRADE_ACTION_DEAL;
req.symbol = _Symbol;
req.volume = lot;
req.type = type;
req.price = price;
req.sl = slPrice;
req.tp = tpPrice;
req.deviation= 20;
req.magic = MagicNumber;
req.comment = comment;
if(!OrderSend(req,res))
{
Print("Trade failed: ",res.retcode);
if(EnableAlerts) Alert("Trade failed: ",res.retcode);
}
else
{
if(EnableAlerts) Alert(comment," opened at ",price);
Print(comment," opened at ",price);
}
}
//+------------------------------------------------------------------+
void UpdateStatus()
{
string text = "SMC GBP PRO EA\nStatus: CONNECTED\nAccount: "+IntegerToString(AccountNumber());
if(PositionsTotal()>0) text += "\nTrade Open!";
Comment(text);
}
//+------------------------------------------------------------------+
void DrawArrow(string name, int shift, double price, color clr, string text)
{
string objName = name + IntegerToString(TimeCurrent());
if(ObjectFind(0,objName) >=0) ObjectDelete(0,objName);
ObjectCreate(0,objName,OBJ_ARROW,0,Time ,price);
ObjectSetInteger(0,objName,OBJPROP_COLOR,clr);
ObjectSetInteger(0,objName,OBJPROP_WIDTH,2);
ObjectSetInteger(0,objName,OBJPROP_ARROWCODE,233); // חץ
ObjectSetString(0,objName,OBJPROP_TEXT,text);
}
------------------------------------------------------------------+
//| SMC GBP PRO EA – FTMO 30M + TP/SL + Trailing Stop |
//+------------------------------------------------------------------+
#property strict
input double RiskPercent = 1.0;
input int RSIPeriod = 14;
input int StopLossPoints = 200;
input int TakeProfitPoints = 400;
input int MagicNumber = 202630;
input bool EnableAlerts = true;
int rsiHandle;
//+------------------------------------------------------------------+
int OnInit()
{
rsiHandle = iRSI(_Symbol, PERIOD_M30, RSIPeriod, PRICE_CLOSE);
Comment("SMC GBP PRO EA\nStatus: CONNECTED\nAccount: ", AccountNumber());
return(INIT_SUCCEEDED);
}
//+------------------------------------------------------------------+
void OnTick()
{
//
UpdateStatus();
// Trailing Stop
ManageTrailing();
if(PositionsTotal() > 0) return;
double rsi ;
CopyBuffer(rsiHandle,0,0,1,rsi);
double high1 = iHigh(_Symbol, PERIOD_M30,1);
double low1 = iLow(_Symbol, PERIOD_M30,1);
double close1= iClose(_Symbol, PERIOD_M30,1);
double high2 = iHigh(_Symbol, PERIOD_M30,2);
double low2 = iLow(_Symbol, PERIOD_M30,2);
//==== HTF TREND (1H EMA50) ====
double emaHTF = iMA(_Symbol, PERIOD_H1, 50, 0, MODE_EMA, PRICE_CLOSE, 0);
double closeHTF = iClose(_Symbol, PERIOD_H1, 0);
bool htfBull = closeHTF > emaHTF;
bool htfBear = closeHTF < emaHTF;
//==== LIQUIDITY SWEEP ====
bool sweepBuy = low1 < low2 && close1 > low2;
bool sweepSell = high1 > high2 && close1 < high2;
//==== BOS ====
bool bosBuy = sweepBuy && close1 > high2;
bool bosSell = sweepSell && close1 < low2;
//==== BUY/SELL CONDITIONS ====
bool buy = bosBuy && rsi > 50 && htfBull;
bool sell = bosSell && rsi < 50 && htfBear;
double lot = CalculateLot(StopLossPoints, RiskPercent);
if(buy)
{
OpenTrade(ORDER_TYPE_BUY, lot, StopLossPoints, TakeProfitPoints, "BUY GBP");
DrawArrow("BUY", 0, low1 - 10*_Point, clrLime, "BUY GBP");
}
if(sell)
{
OpenTrade(ORDER_TYPE_SELL, lot, StopLossPoints, TakeProfitPoints, "SELL GBP");
DrawArrow("SELL", 0, high1 + 10*_Point, clrRed, "SELL GBP");
}
}
//+------------------------------------------------------------------+
double CalculateLot(int slPoints, double riskPercent)
{
double riskMoney = AccountBalance() * riskPercent / 100.0;
double lot = riskMoney / (slPoints * _Point * 10);
lot = MathMax(lot,0.01);
return(NormalizeDouble(lot,2));
}
//+------------------------------------------------------------------+
void OpenTrade(ENUM_ORDER_TYPE type,double lot,int sl,int tp,string comment)
{
double price = (type==ORDER_TYPE_BUY) ? SymbolInfoDouble(_Symbol,SYMBOL_ASK)
: SymbolInfoDouble(_Symbol,SYMBOL_BID);
double slPrice = (type==ORDER_TYPE_BUY) ? price - sl*_Point
: price + sl*_Point;
double tpPrice = (type==ORDER_TYPE_BUY) ? price + tp*_Point
: price - tp*_Point;
MqlTradeRequest req;
MqlTradeResult res;
ZeroMemory(req);
req.action = TRADE_ACTION_DEAL;
req.symbol = _Symbol;
req.volume = lot;
req.type = type;
req.price = price;
req.sl = slPrice;
req.tp = tpPrice;
req.deviation= 20;
req.magic = MagicNumber;
req.comment = comment;
if(!OrderSend(req,res))
{
Print("Trade failed: ",res.retcode);
if(EnableAlerts) Alert("Trade failed: ",res.retcode);
}
else
{
if(EnableAlerts) Alert(comment," opened at ",price);
Print(comment," opened at ",price);
}
}
//+------------------------------------------------------------------+
void UpdateStatus()
{
string text = "SMC GBP PRO EA\nStatus: CONNECTED\nAccount: "+IntegerToString(AccountNumber());
if(PositionsTotal()>0) text += "\nTrade Open!";
Comment(text);
}
//+------------------------------------------------------------------+
void DrawArrow(string name, int shift, double price, color clr, string text)
{
string objName = name + IntegerToString(TimeCurrent());
if(ObjectFind(0,objName) >=0) ObjectDelete(0,objName);
ObjectCreate(0,objName,OBJ_ARROW,0,Time ,price);
ObjectSetInteger(0,objName,OBJPROP_COLOR,clr);
ObjectSetInteger(0,objName,OBJPROP_WIDTH,2);
ObjectSetInteger(0,objName,OBJPROP_ARROWCODE,233); // חץ
ObjectSetString(0,objName,OBJPROP_TEXT,text);
}
//+------------------------------------------------------------------+
void ManageTrailing()
{
for(int i=PositionsTotal()-1;i>=0;i--)
{
ulong ticket = PositionGetTicket(i);
if(PositionSelectByTicket(ticket))
{
double price = PositionGetDouble(POSITION_PRICE_OPEN);
double sl = PositionGetDouble(POSITION_SL);
double tp = PositionGetDouble(POSITION_TP);
ENUM_POSITION_TYPE type = (ENUM_POSITION_TYPE)PositionGetInteger(POSITION_TYPE);
double newSL = 0;
if(type == POSITION_TYPE_BUY)
{
double trail = SymbolInfoDouble(_Symbol,SYMBOL_BID) - StopLossPoints*_Point;
if(trail > sl) newSL = trail;
}
else if(type == POSITION_TYPE_SELL)
{
double trail = SymbolInfoDouble(_Symbol,SYMBOL_ASK) + StopLossPoints*_Point;
if(trail < sl) newSL = trail;
}
if(newSL != 0)
{
MqlTradeRequest req;
MqlTradeResult res;
ZeroMemory(req);
req.action = TRADE_ACTION_SLTP;
req.symbol = _Symbol;
req.position = ticket;
req.sl = newSL;
req.tp = tp;
OrderSend(req,res);
}
}
}
}

King Trade 4 and 3 hour buy-sell strategy V2This strategy is a Trend-Following Breakout System specifically designed for high-volatility environments like the 4-hour and 3 hour (3h) (4H) timeframe. It focuses on identifying "Smart Money" movements by combining price action with significant volume surges.
Here is the breakdown of the strategy logic:
1. The Core Signal (Breakout)
The strategy identifies a level using the previous candle's High and Low.
Long Entry: Occurs when the current price crosses above the previous candle's high.
Short Entry: Occurs when the current price crosses below the previous candle's low.
2. The Smart Money Filter (Volume)
A price breakout without volume is often a "Bull Trap" or "Bear Trap." To minimize fake signals, this strategy calculates a Volume Moving Average (SMA 20).
It only enters a trade if the breakout candle's volume is at least 1.5x (or your chosen multiplier) higher than the average. This ensures that the move is backed by institutional or high-intensity trading.
3. The Trend Filter (EMA 200)
To stay on the right side of the market, the strategy uses the 200-period Exponential Moving Average (EMA) as a "Trend Guard":
Only Longs are allowed if the price is above the EMA 200 (Uptrend).
Only Shorts are allowed if the price is below the EMA 200 (Downtrend). This prevents you from buying into a crashing market or selling during a strong bull run.

Candle Intelligence🔹 Candle Intelligence (IM-CI)
Candle Intelligence (IM-CI) is a context-only intraday market behavior indicator designed to help traders understand how price is behaving, not where to buy or sell.
This tool classifies individual candles, detects short-term behavioral patterns, and displays a non-blocking market state to improve decision awareness during live trading.
⚠️ IM-CI does NOT generate buy/sell signals.It is strictly intended for market context, confirmation, and study.
🔍 What This Indicator Does
🧠 Candle Intelligence Layer
Each candle is classified based on volatility-adjusted behavior using ATR:
Strong expansion candles
Normal directional candles
Weak / neutral candles
These classifications are shown as compact candle codes (optional) to quickly read price behavior without clutter.
📐 Pattern Recognition (Context Only)
IM-CI detects short, non-predictive behavioral patterns, such as:
Compression
Absorption
Momentum bursts
Distribution
These patterns are displayed as soft zones, not signals, helping traders visually study how price reacts around key moments.
Cooldown logic is used to prevent repetitive pattern noise.
🌐 Market State Engine
The indicator continuously evaluates recent candle behavior and VWAP positioning to describe the current market condition, such as:
Expansion
Extended
Distribution
Balanced
This state is shown in a small HUD panel and is designed to:
Reduce emotional over-trading
Identify unsuitable market conditions
Improve alignment with higher-probability environments
⚙️ Key Features
ATR-aware candle classification
VWAP extension detection
Timeframe-adaptive candle code visibility
Non-repainting logic
Clean, lightweight HUD panel
Designed for intraday futures & index trading
🛠 How to Use
Use IM-CI as a context filter, not a trigger
Combine with your own execution system
Avoid trading during Extended or unclear states
Best suited for lower timeframes (1–5 min)
⚠️ Disclaimer
This indicator is provided for educational and informational purposes only. It does not constitute financial advice and should not be used as a standalone trading system.
All trading decisions remain the sole responsibility of the user.

ATR Momentum StatusThis indicator measures whether volatility (ATR) is increasing or decreasing, and classifies momentum strength into four clear states:
- WEAK
- STRONG
- EXPANSION
- DECREASING
It helps traders avoid fake moves and only trade when real participation enters the market, especially when used together with FVG CE Acceptance (SMC).
ATR Momentum States (Very Important)
Status Meaning Market Condition
WEAK Small ATR increase Low participation
STRONG Healthy ATR increase Real buyers/sellers entering
EXPANSION Large ATR spike Aggressive momentum / breakout
DECREASING ATR falling Momentum dying / trap risk
What This Indicator Is NOT
❌ Not a buy/sell signal
❌ Not direction bias
❌ Not entry by itself
👉 It is a trade quality filter
✅ Best Use Case (SMC / FVG Traders)
This indicator shines when combined with:
- FVG
- CE (Consequent Encroachment)
- Liquidity Sweep
- Acceptance Candle
Important Risk Filter (Golden Rule):
ATR Status Trade Quality
EXPANSION + Acceptance ⭐⭐⭐⭐⭐ (Best)
STRONG + Acceptance ⭐⭐⭐⭐
WEAK + Acceptance ❌ Avoid
DECREASING ❌ No Trade
Why This Works (Conceptually):
- FVG CE acceptance = price is accepted
- ATR expansion = participation is real
- Together = institutional momentum, not retail noise
